An AI Project Proposal
Intro
Some overall info of the project and files related to this version of the proposal.
Tree

Some overall info of the project and files related to this version of the proposal.

In respect to the overall brain structure of this AI, this part would represent somewhat of a visual cortex, at least in the sense of converting from image files. Ideally we would have a camera sensor that can give accurate data in a form that is more useful. This conversion allows the image analysis process to be separate from a process that supports all patterns by breaking apart the learning algorithm and having to determine the representation format as well.
The main problem with a grid is the irregular distance between the points. Assuming:
Keys areIf I want to compare img[5] to img[6] its easy and their distance is 1, whereas if I want to compare img[5] to img[9], for example, their distance is √2.
However if I consider only vectors through the available data, in this case there would 20:
The distance between each element for img[4, 5, 6] is 1, img[2, 6] is (√5)/2, img[1, 5, 9] is √2. Because I can consider them as vectors, I just consider the x value to be the index of the value and the y location is the y value of the data, therefore the index (x-coord) of the slice of data can be normalized to its own context and considered with a distance of 1 between each element. This is because when the data is considered in the output, its either adjusted for being in a grid or is just rendered out as an image and so the grid stays continuous.
The important part with images is that they are a series of 3D values and I want to choose slices of the image to analyze on. Each of these slices act as a 2D section and can be analyzed with the overall algorithm in this proposal.
This method allows distance inaccuracies to be removed by saving them in the visual cortex.
Has drawbacks, isn't as accurate, can't do nearly as much, might be able to find patterns in data despite arbitrary placement. Or sequential, depending how you consider it.
When considering how to break apart images into a single stream of data pieces, I found two main approaches. Typically, the software systems that I had seen so far stored data as
[[red values], [green values], [blue values]] or [[column 1 [rows of col 1]], column 2 [rows of col 2],column 3 [rows of col 3], etc...] or [r1, g1, b1, r2, g2, b2, etc...]. Initially I could test with [[r], [g], [b]] but should ultimately use [r1, g1, b1, r2, g2, b2, etc]. The first method conceptually prioritizes location whereas the second prioritizes value and simplicity of access.
2/29/16, 9:56 AM
Color pattern detector idea:
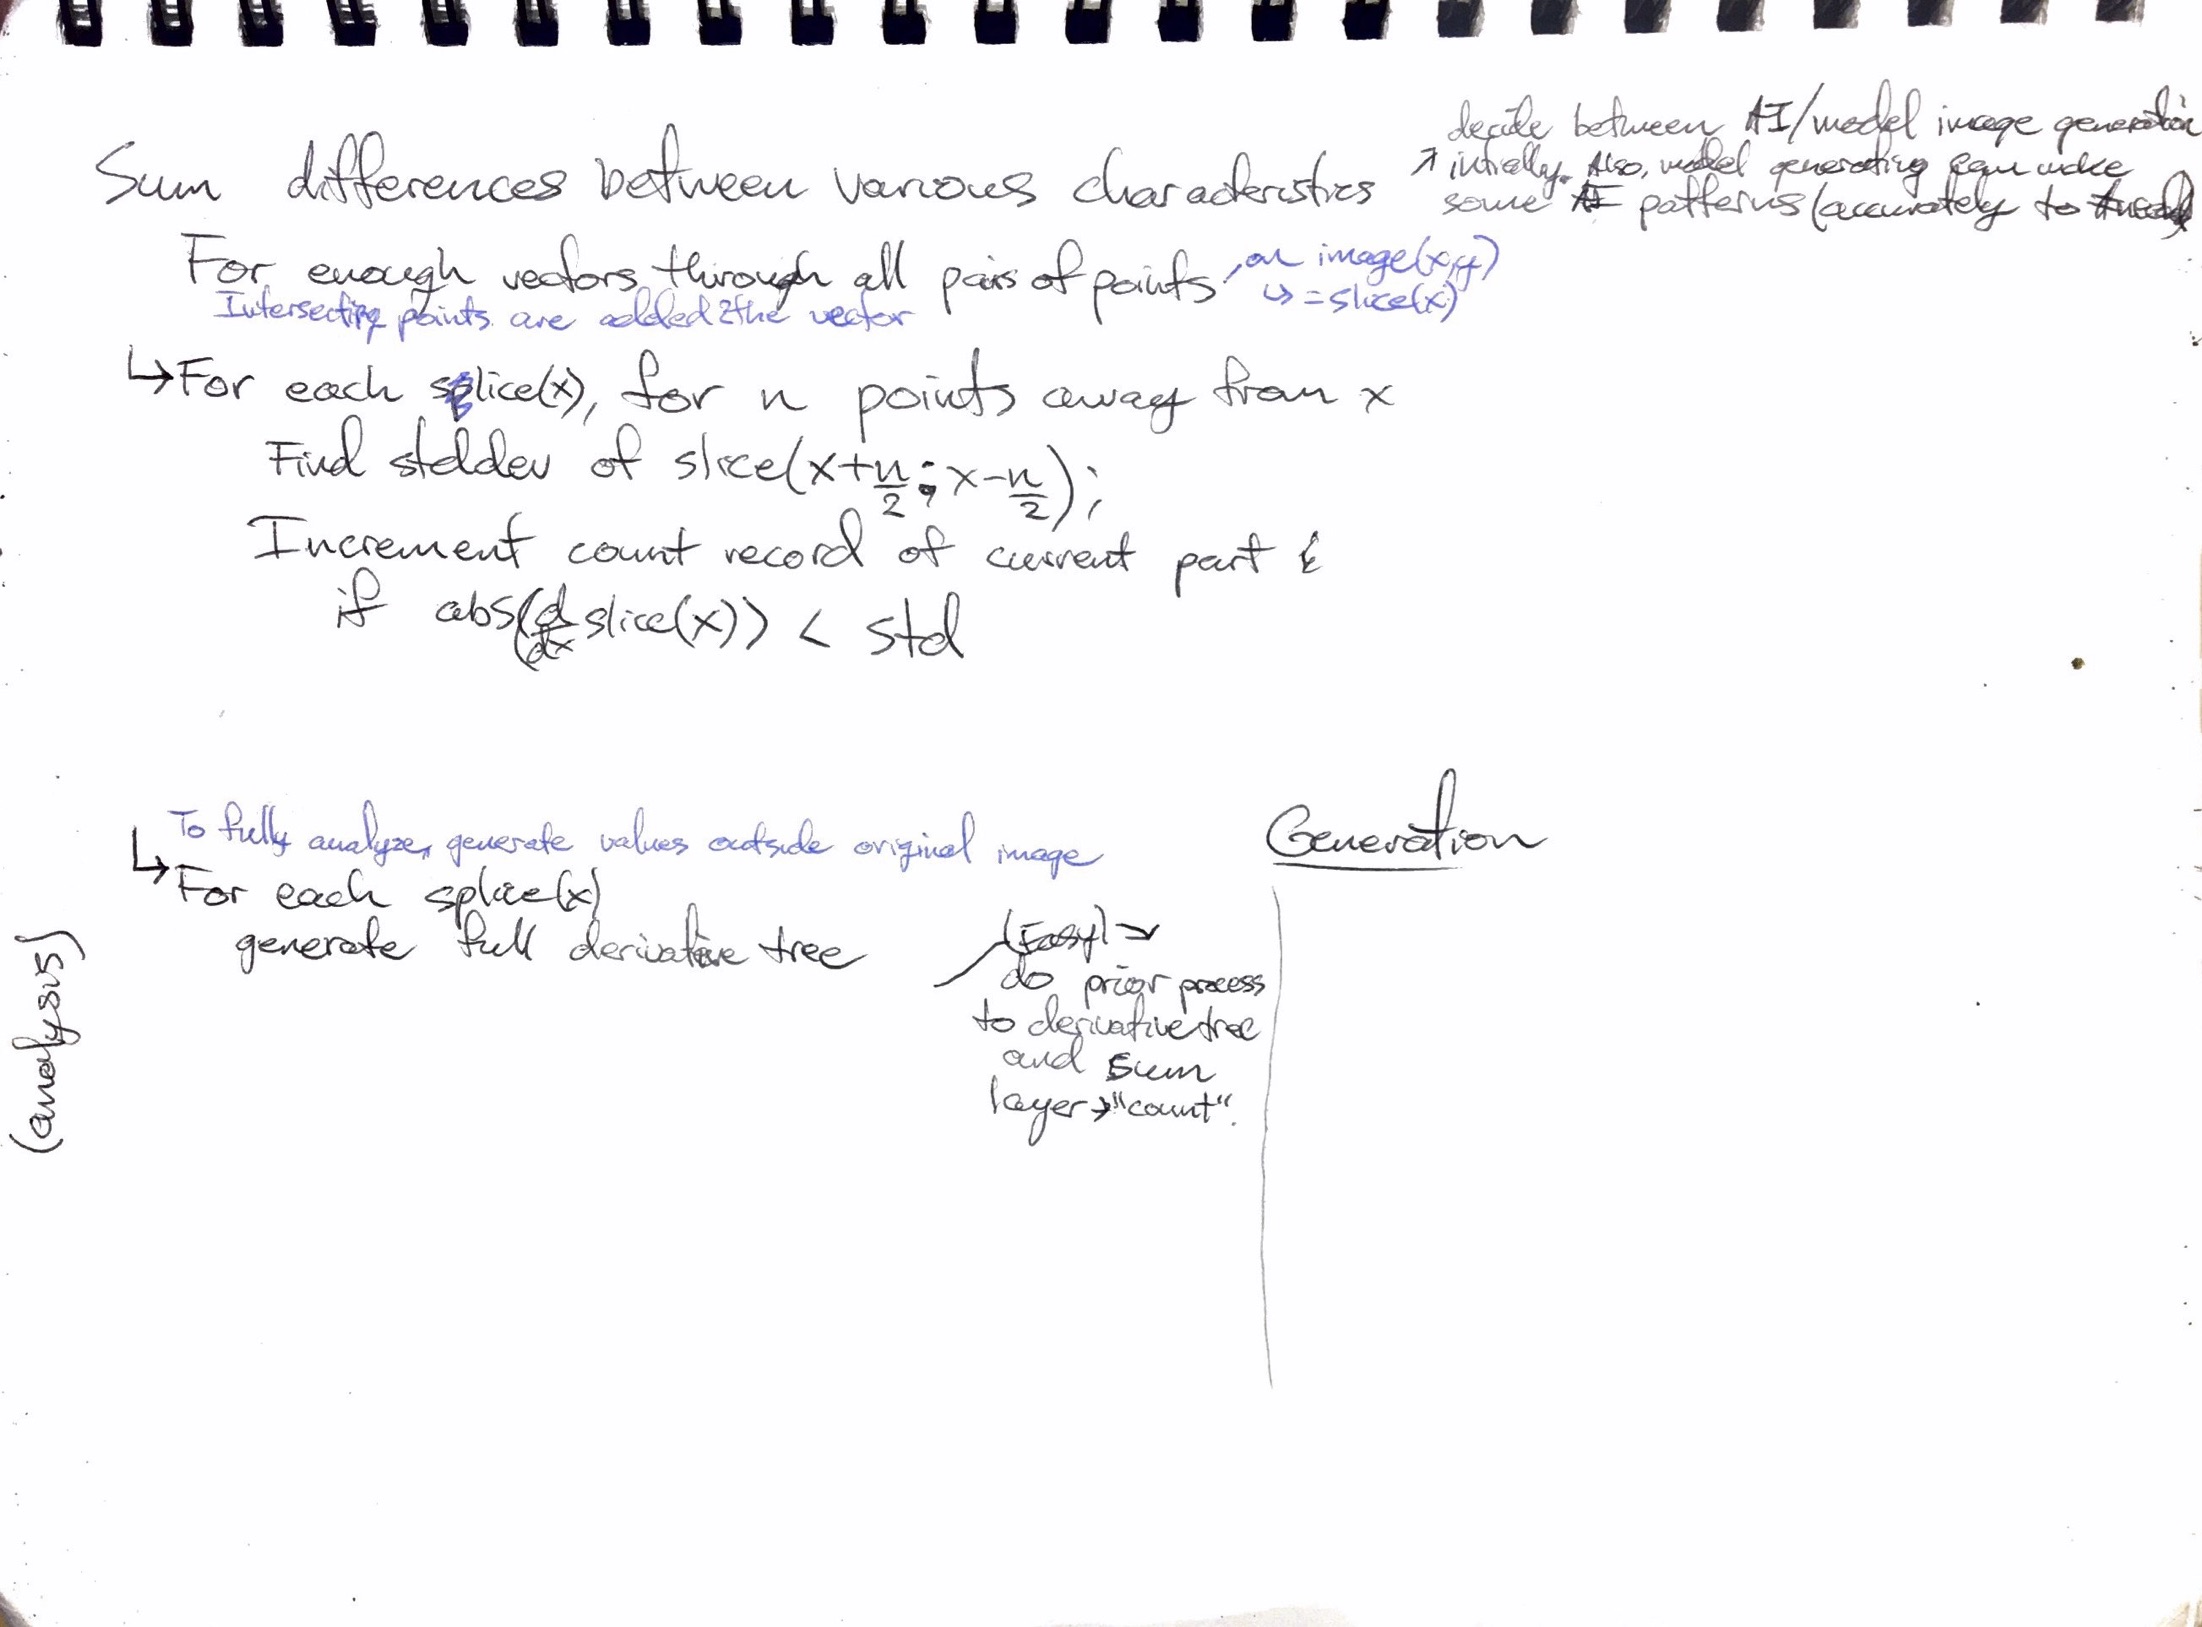
Find derivatives of all color channels of both directions.
If 3D derivatives exist, find 3D derivative of entire image
smooth derivative

For each of these datasets, smoothing might be necessary. Originally I created this part of the algorithm to decrease noise. Unfortunately, this might lead to some inaccurate data in some situations and subpixel data gets skewed. This also will not work for subpixel patterns unless the pattern also exists in a higher accuracy part of the image.
This alorithm might be similar to gaussian.
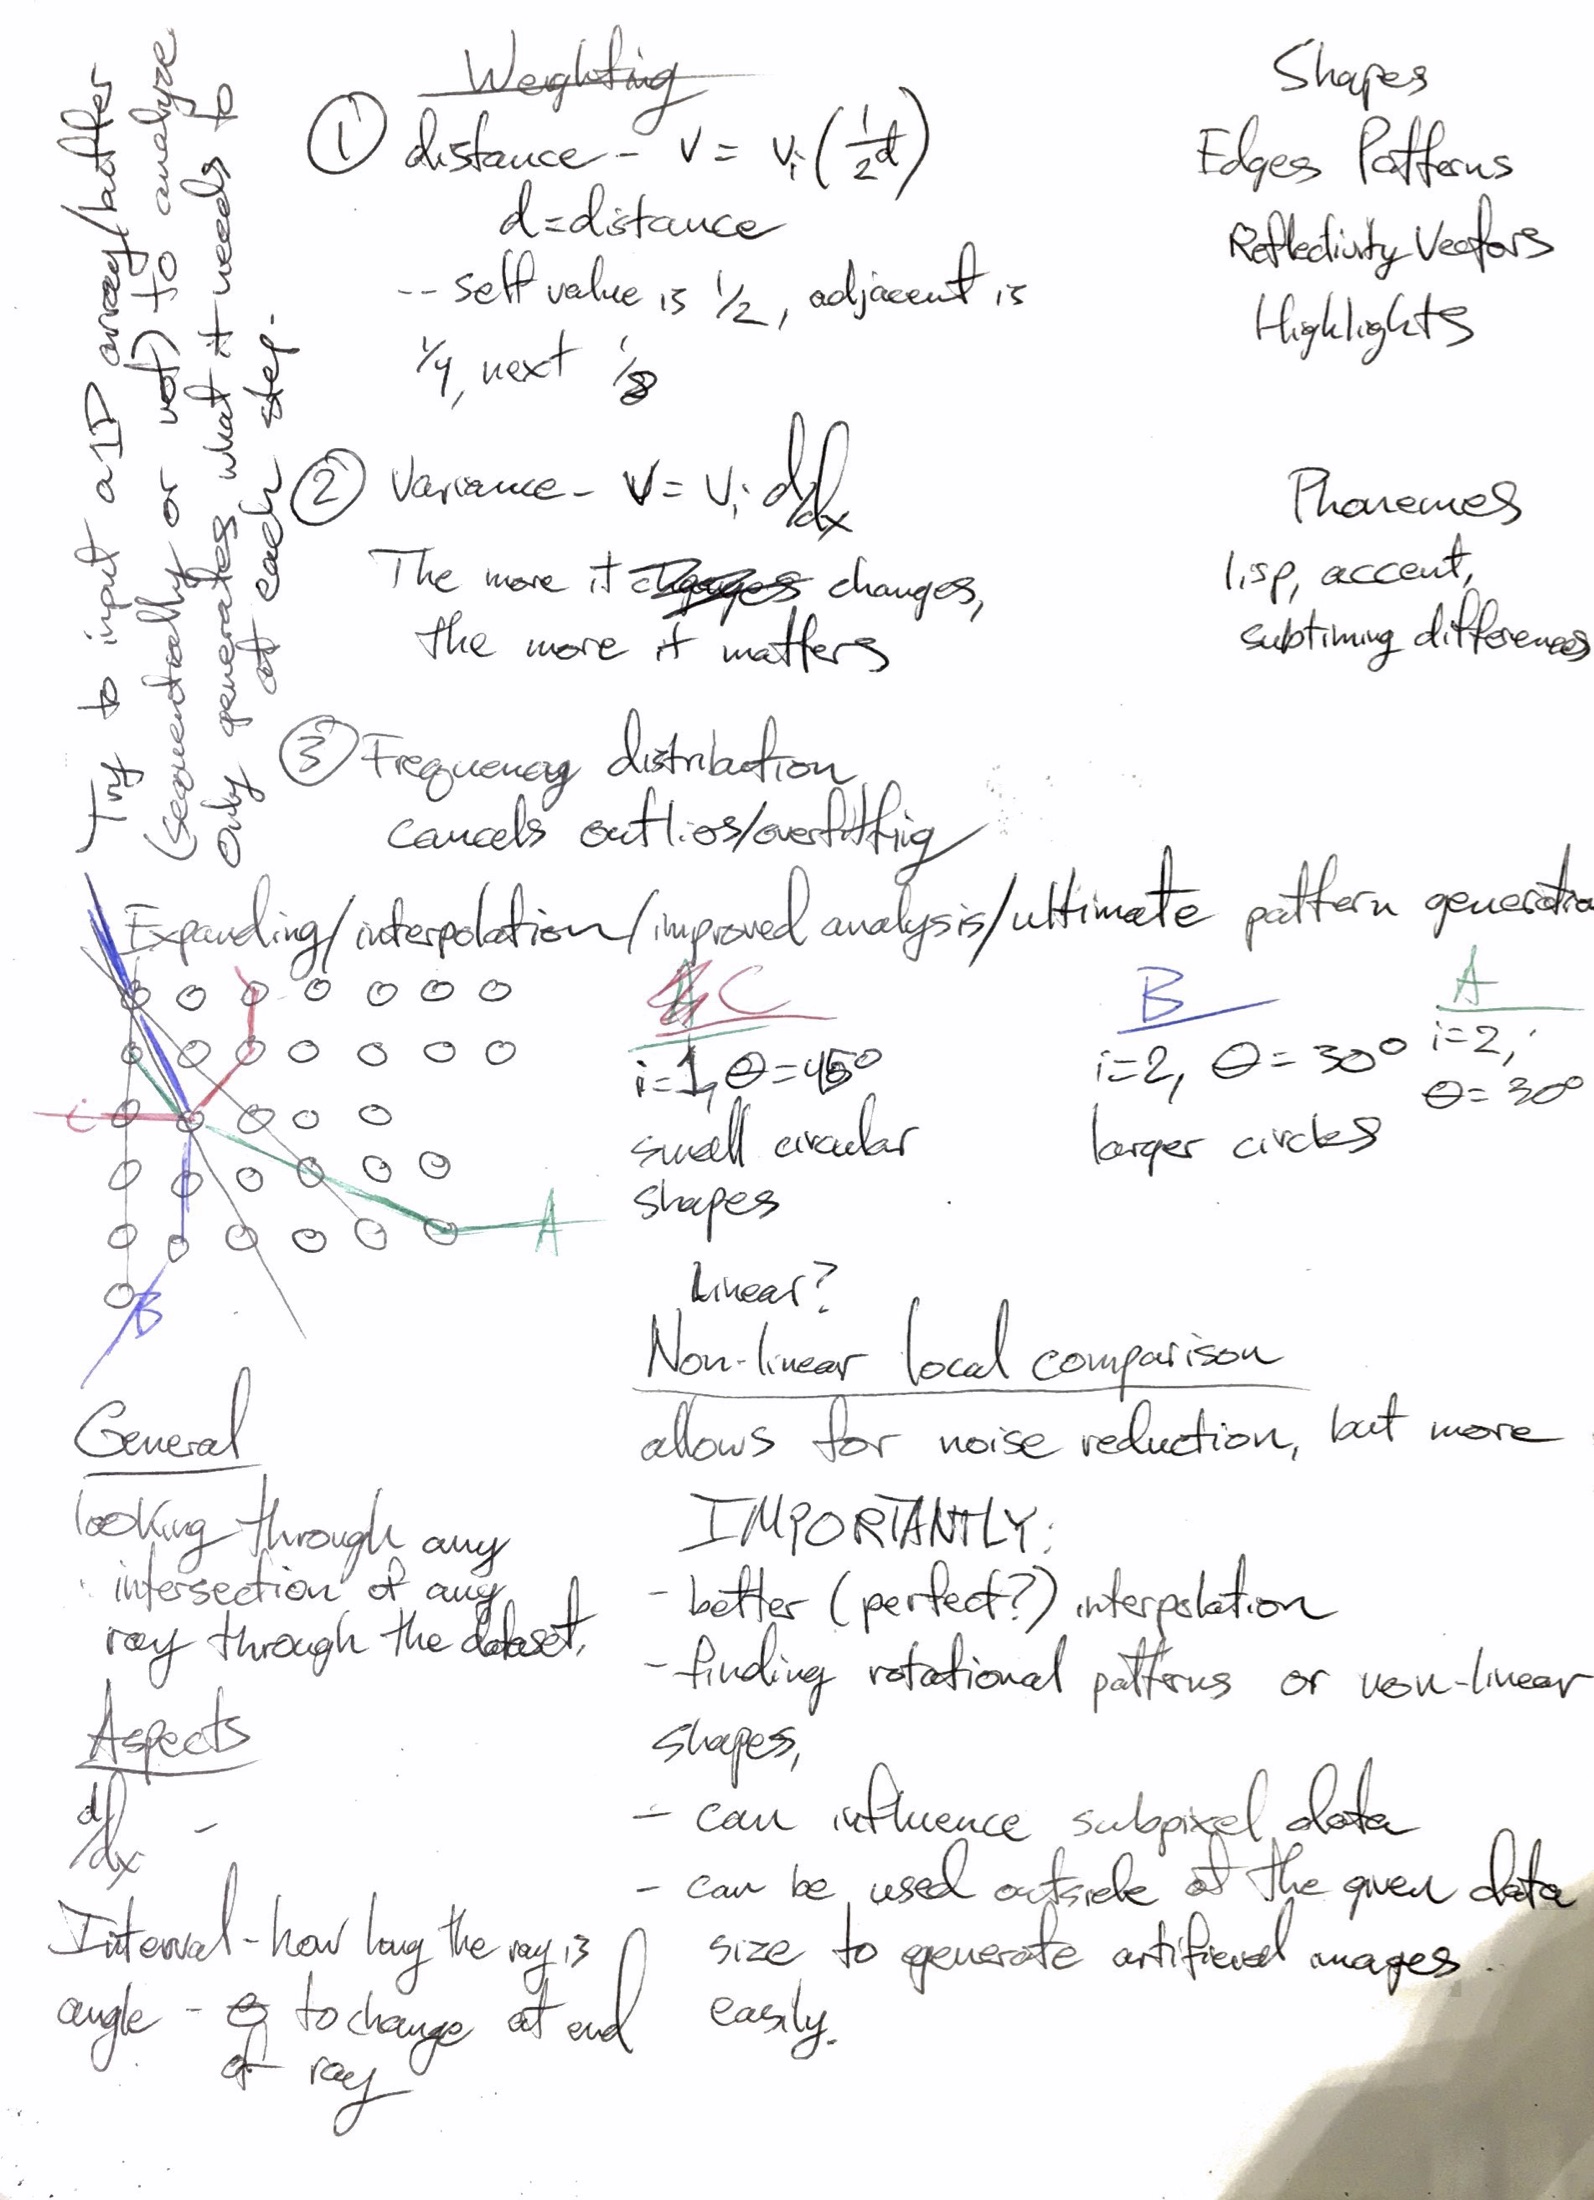
Weighted by 1/(2^(d-1)) when d is distance from the current index.

Sample image in this example

This weighting scheme (function) may need to be altered later, can be assumed right for now. As an infinite series its limit is 1, that is significant.
When considering how to derive a grid based dataset, I wanted to get rid of bias of data location and distance between each other, as well as considering directions and ideally a bigger distance than 1. Another approach, however, is to make the entire algorithm as each pixel can only 1 away and has to calculate everything based on that. With a basic computational derive, f'(x) = f(x-1) - f(x) when the domain is 0 < x < n.
In an image represented as a 1D array of data, this means that the derivative is only the difference between a pixel and the one to the left of it (and a leftmost pixel is that one minus the last on the previous row).
Consider N to be the length of the 2D slice. As we derive along this 2D dataset, the length decreases by 1 each time we take a new derivative. There are N-1 derivatives.
See the Pen Image cross section view by Andrew Nyland (@andrewnyland) on CodePen.
Since edges aren't really obtainable from a grid, I threw away most uses for the grid and worried only about how to convert any data into a 1D form, but looking at data on a grid has some benefits. These benefits really only exist if the grid output data is also going to be output in the same manner, and therefore is ideologically continuous with its context. For example, this means that the algorithm doesn't need to know where an edge is, it just has to find it and then draw it where it found it.
Idk if this has much use besides placement of labels of recognized objects.
Object location can be found by finding a shade/shape and then simply finding either the center or weighted center (similar to center of mass). Center is just (cross section of shape)/2 and then averaged, weighted center is sum(the similarities)/(amt of values).
Not sure if I have a use for this.

Some info about this, this sentence was put here for testing.


When each pixel looks around as vectors at all of the pixels around it, it builds a web of differentiation to all of the pixels around it, both in value and behavior. For any vector going out it can make a list of shades and make a linked list of all of the vectors between any pixels that create a shade. This can be referenced either by pixel value or as a single list of shades for the image itself.

Two examples of how looking at pattern trajectory patterns can find some progressions and shapes. When looking for shades, this allows for a different method of storing an shape abstractly for comparison.
When mixed with looking at all vectors regardless of a vector over the whole image that is only on a locality to the pixel, we get:
An image such as:2D because [x, y], c from (r, g, b) is really just factors of frequency
3/3/16, 11:58 PM
aspects:

where the light sources are
the orientation and outline of objects in the pic

find brightness of pixels in image:
	- cumulate shades of color in image
		for all channels in all pixels, from 0 -> 255, from maxX, maxY .> 1:
			find shades in [maxDistance, 1] min radius
			increment the value of that pixel, then multiply times (255/max(pixels))
	-derivative of pixels (weighted)


weighting function:
var value, distance, maxDistance
func f(value, distance) {
	return value*distance/(maxDistance^2);
}
2/27/16, 12:41 AM
For all pixels,
find all shades that exist for more than a certain distance away (independent variable) - output value is (count of these / total ) * 255;
Or frequency of overlapped frequencies more than one pixel? Where more shades overlap it will be brighter and so only shapes will show.
Generates a probability cloud of colors based on the given image. Also consider subpixel analysis.
These patterns of movement variation can be used for both sub-pixel image regeneration as well as artificial generation outside of an image, at a predictable but severely decreasing accuracy. Can be generated past -100% accuracy/probability.
Also could be used for general categorization. For example when I upload images to my website, I want them to organize themselves into a few most relevant categories.
Given a string such as asdfeoipoasfd and a string to compare to such as asdfeo. Full string and substring.
This can be found pioefd and adeiosd would have a similarity of 50% (probs) but is not a match. Reversed substring and every other character is order.
The endocannabinoid system (ECS) is a biological system composed of endocannabinoids, which are endogenous lipid-based retrograde neurotransmitters that bind to cannabinoid receptors, and cannabinoid receptor proteins that are expressed throughout the mammalian central nervous system (including the brain) and peripheral nervous system.
- Wikipedia
It provides a feedback system to neurons so they can learn faster.